Applying Machine Learning Techniques on Wine Rankings
Goal
Look for a relationship between chemical properties of wine and their quality rating from experts. Will explore several different models (linear regression, logistic regression & Neural Networks) to try to find an accurate predictor.
Data Collection
Data imported from:
P. Cortez, A. Cerdeira, F. Almeida, T. Matos and J. Reis. Modeling wine preferences by data mining from physicochemical properties. In Decision Support Systems, Elsevier, 47(4):547-553, 2009.
Obtained a CSV file of 1600 samples of wine. Features are:
"fixed acidity"
"volatile acidity"
"citric acid"
"residual sugar"
"chlorides"
"free sulfur dioxide"
"total sulfur dioxide"
"density"
"pH"
"sulphates"
"alcohol"
"quality" - a whole number between 1 & 10, is the output variable and what I will be trying to predict as an function of the other feautures.
redWines = pd.read_csv('winequality-red.csv', delimiter=";")
y = redWines['quality']
X = np.stack(redWines.drop(columns=['quality']).values)
Data Engineering
Since several features were on different scales I applied mean normalization:
X=(X-X.mean())/X.std()
Some features also show a great deal of correlation:

After confirming they had no impact on model accuracy, citric acid and and fixed acidity were dropped. PH sufficiently gave the same information.
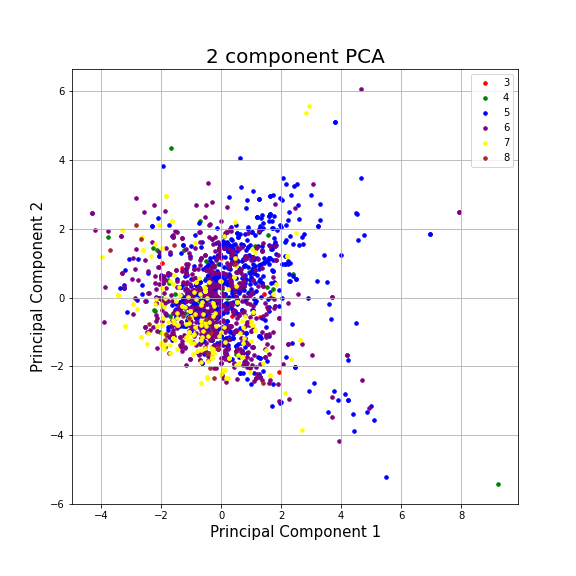
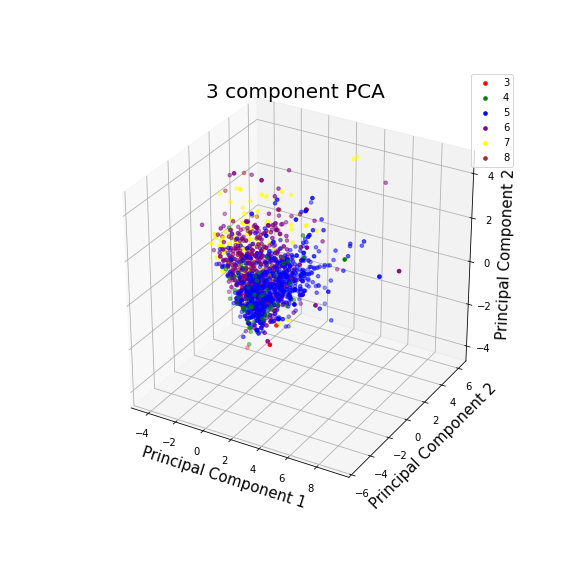
I considered applying PCA but it lead to a significant loss of information:
Components = 2

pca.explained_variance_ratio_
array([0.23738404, 0.18819661])
Components = 3

pca.explained_variance_ratio_
array([0.23738404, 0.18819661, 0.15882354])
Results
Linear Regression
Training/Test split:
X_train, X_valid, y_train, y_valid = train_test_split(X, y, test_size=0.2)
Model:
model = make_pipeline(
    LinearRegression()
)

model.fit(X_train, y_train.values)
Score:
Runnning with 100 different test/train splits average scores were:
Red Wine Training Score: 0.361
Red Wine Validation Score: 0.348
The scores here are the R2 coefficient and essentially shows how correlated ((y_true - y_pred) ** 2).sum() and the residual sum of squares ((y_true - y_true.mean()) ** 2).sum() are. ~0.27 - 0.35 are pretty weak correlations. The training score and validation score are very close though so at least the model is generalizing well and not biased.
I also calculated the mean-squared error to get a better sense of how far away my predictions were:
y_predicted = model.predict(X_train)
regression_model_mse = mean_squared_error(y_predicted, y_train.values)
regression_model_mse
print(math.sqrt(regression_model_mse))
This gave an average error in quality rating around:
Red Wine MSE: 0.65
The data proved to be not very polynomial as adding these features quickly led to poor validation scores:
model = make_pipeline(
    PolynomialFeatures(degree=2),
    LinearRegression()
)
Adding logarithmic transformation also had no impact on scoring.
The main issue is the output variable, quality. It is essentially on a discrete scale since quality ratings are given as a whole number in range 1 - 10 (only 3 - 8 are actually assigned in the dataset).

With this in mind linear regression may have not been the right tool for this job.
Logistic Regression
With the all the quality ratings belonging to [3,4,5,6,7,8] classification seems like an appropriate choice for this dataset.
| Quality | Frequency |
|---|---|
| 5 | 0.425891 |
| 6 | 0.398999 |
| 7 | 0.124453 |
| 4 | 0.033146 |
| 8 | 0.011257 |
| 3 | 0.006254 |
Like with linear regression the data was underfitting the test set
model = make_pipeline(
    LogisticRegression(max_iter=250)
)
Red Wine Training Score: 0.567
Red Wine Validation Score: 0.562
(The score here is the ratio of correctly predicted classes)
model = make_pipeline(
    LogisticRegression(C=1e4, max_iter=250)
)
To tackle this I raised the regularization parameter and that lead to, marginally, better performance:
Red Wine Training Score: 0.596
Red Wine Validation Score: 0.592
This is certainly better than chance and predictions are usually off by just a single rating:
confusion_matrix2 = confusion_matrix(y_train.values, y_predicted,labels=[3,4,5,6,7,8])
print(confusion_matrix2)
    3    4   5   6   7   8
3[[  0   0   7   0   0   0]
 4[  0   0  29  16   2   0]
 5[  0   0 408 122   2   0]
 6[  0   0 171 328  16   0]
 7[  0   0   9 126  26   0]
 8[  0   0   0   9   8   0]]
Conclusion
Using Linear and Logistic regression lead to some significantly better than chance results but not quite what I was hoping for. While not written about here, other learning algorithms like Support Vector Classes and Neural Networks gave almost identical scores as Logistic Regression. I believe the issue lies in the nature of the target variable (wine quality). A 5/10 wine vs a 6/10 wine are fairly similar labels when it comes to classification; it’s not apples vs oranges. I will perform some error analysis and report on anything I find in the next post as well as build a classifier to differentiate red vs white wine; a task I expect the ML algorithms to perform much better on.